NITI Aayog Investment Friendliness Index 2026: Key Ranking and Findings
#GS-2 #GS-3 #Economy #Governance & Social Justice #Growth #Infrastructure #National #Government Policies & Interventions #Liberalization
Why in News
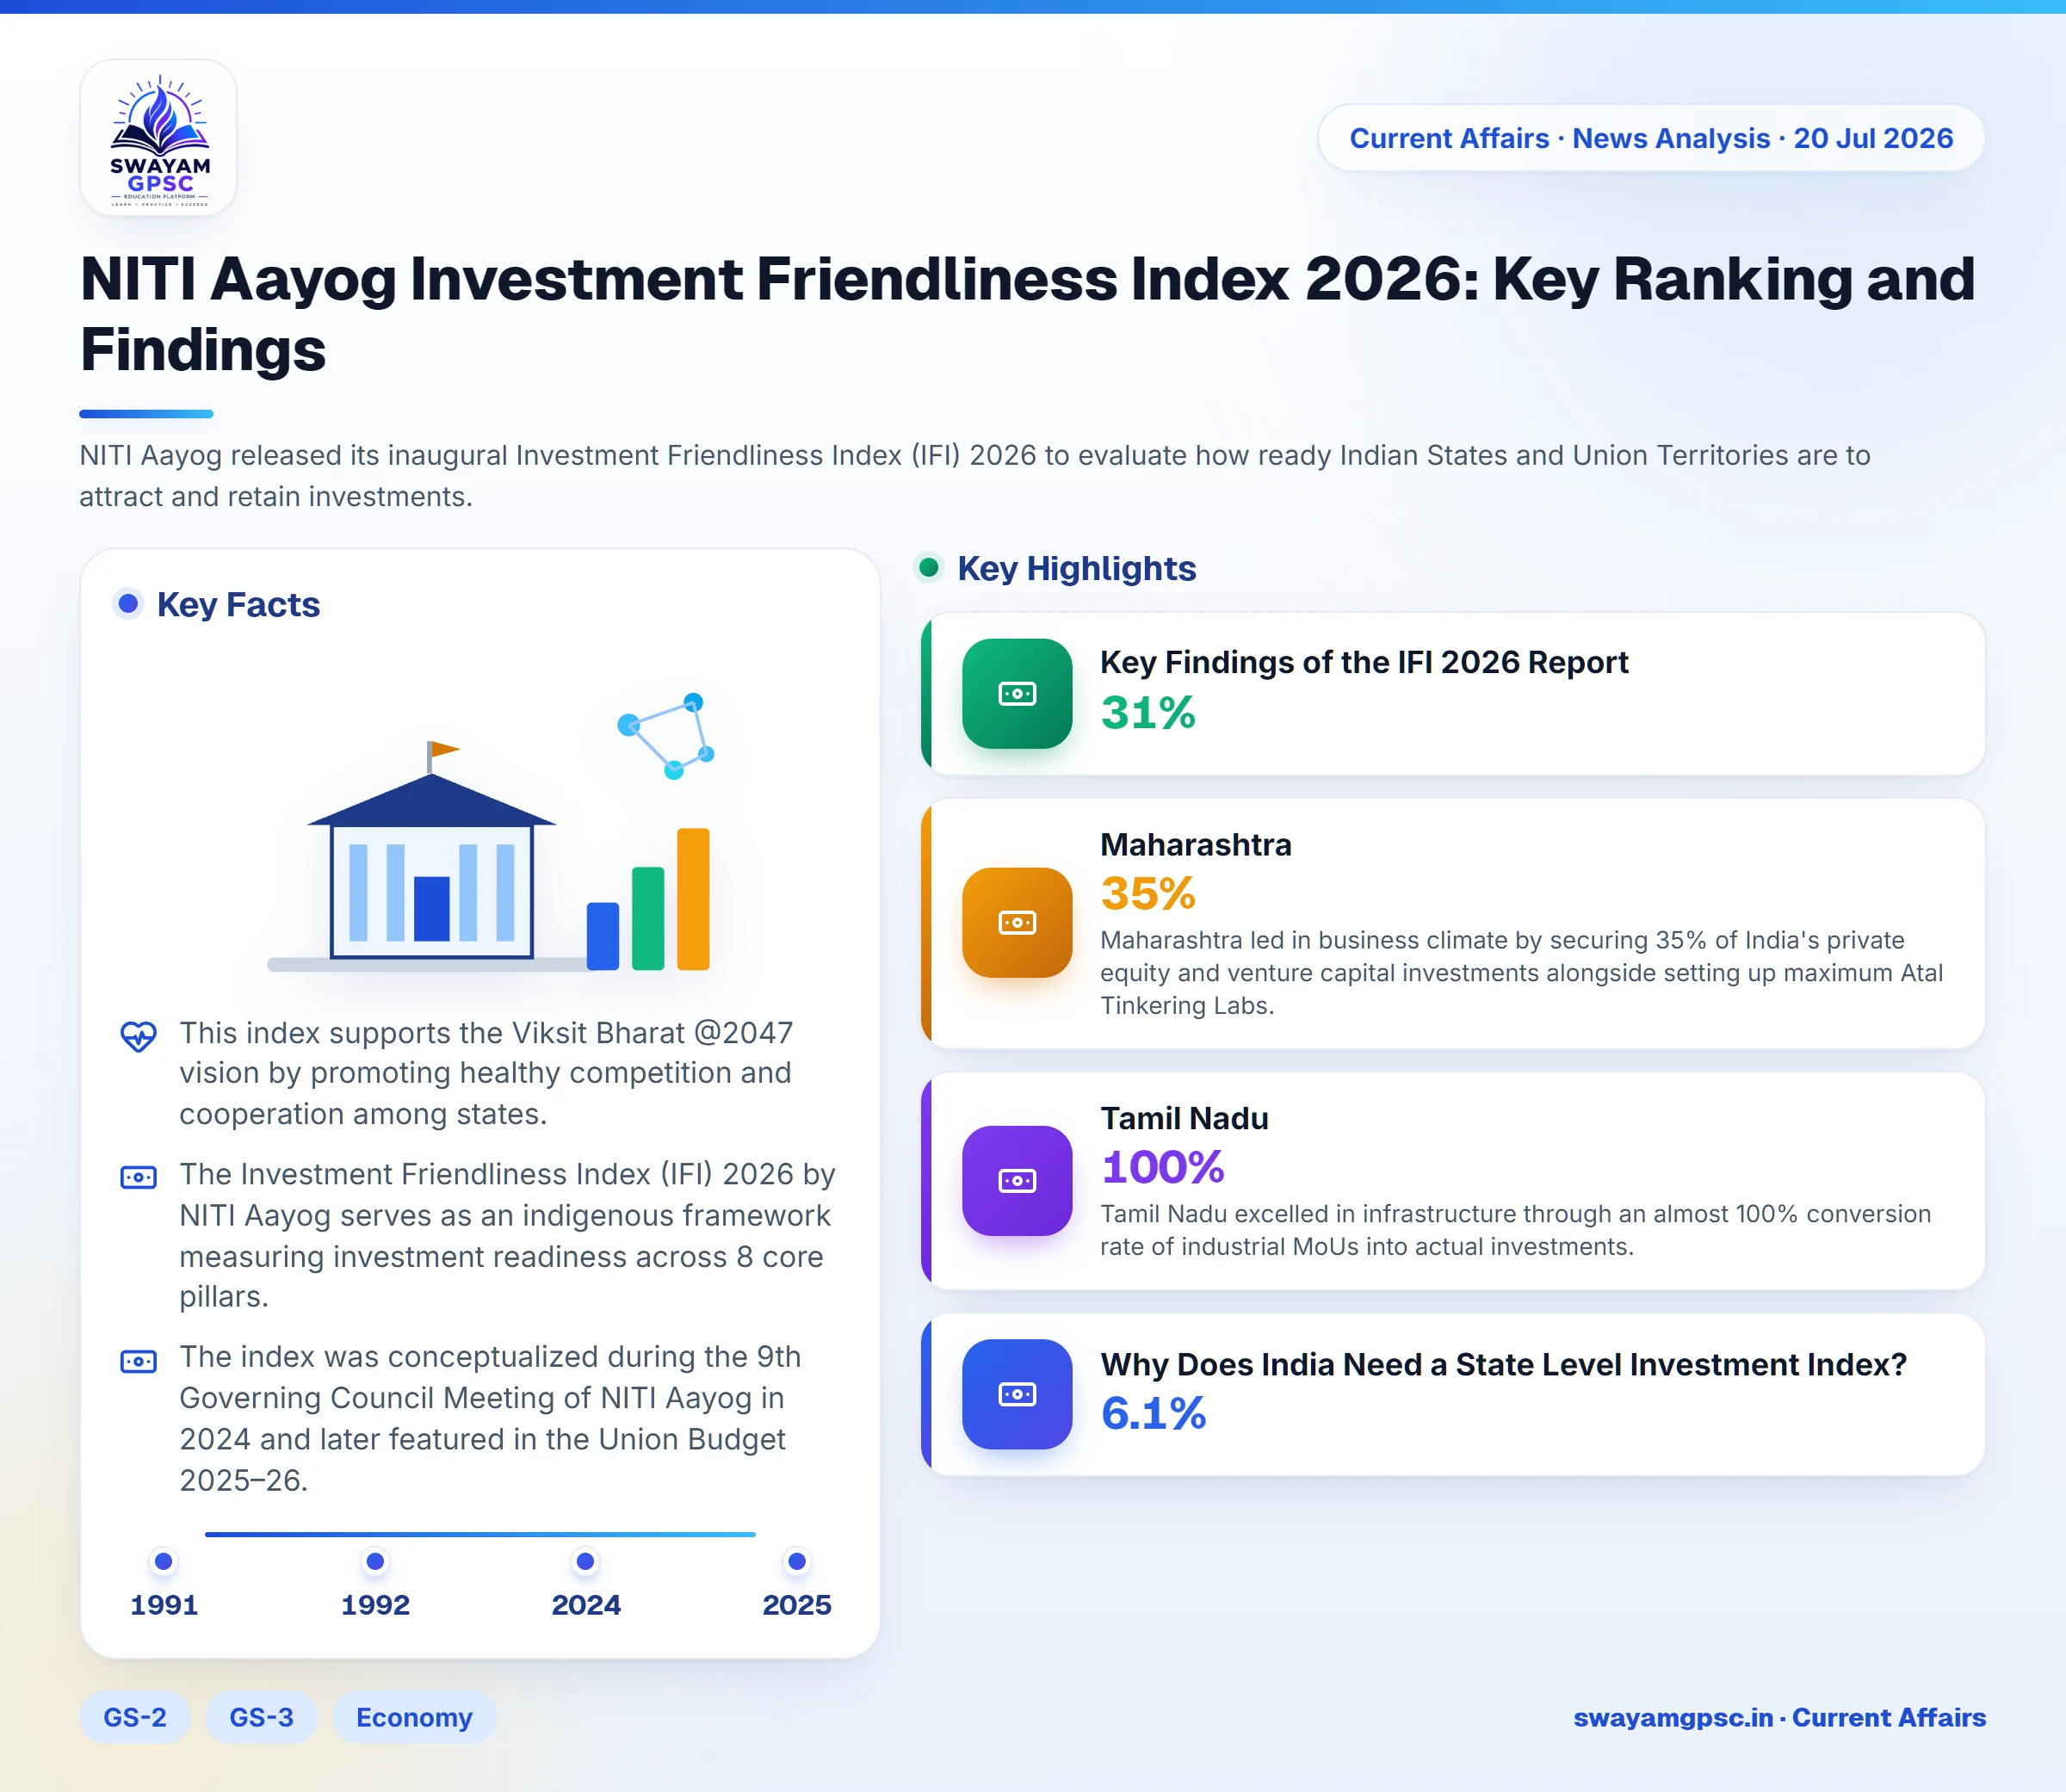
- NITI Aayog released its inaugural Investment Friendliness Index (IFI) 2026 to evaluate how ready Indian States and Union Territories are to attract and retain investments.
- This index supports the Viksit Bharat @2047 vision by promoting healthy competition and cooperation among states.
Summary
- The Investment Friendliness Index (IFI) 2026 by NITI Aayog serves as an indigenous framework measuring investment readiness across 8 core pillars.
- The report identifies key regional gaps, logistics barriers, and regulatory delays, while recommending solutions like single window systems and better infrastructure.
What is the Investment Friendliness Index (IFI)?
- The index was conceptualized during the 9th Governing Council Meeting of NITI Aayog in 2024 and later featured in the Union Budget 2025–26.
- It replaces the old World Bank Ease of Doing Business framework with an in house methodology using 84 indicators alongside investor perception surveys.
- The index evaluates 28 States and 8 Union Territories on a scale of 100 points to assess overall economic competitiveness.
- The Infrastructure pillar evaluates physical logistics networks, power supply reliability, and digital connectivity across regions.
- The Business Climate pillar measures how efficiently single window approval portals function and ensure continuous business operations.
- The Resources pillar assesses the availability of industrial land parcels, skilled labor forces, and essential raw materials.
- The Government Policy pillar measures whether state policies remain stable and predictable over long periods.
- The Regulatory Ease pillar evaluates how effectively states reduce administrative paperwork and compliance burdens for businesses.
- The Institutional Environment pillar examines how transparent, capable, and responsive state institutions are to business needs.
- The Financial Health pillar evaluates fiscal discipline, debt levels, and general macroeconomic stability at the state level.
- The Environmental Resilience pillar measures ecological compliance standards and long term sustainability practices.
- States scoring above 50 points fall under the Top Performers tier.
- States scoring between 45 and 50 points fall under the Frontrunners tier.
- States scoring between 40 and 45 points fall under the Emerging Performers tier.
- States scoring below 40 points fall under the Aspiring States tier.
Key Findings of the IFI 2026 Report
- Gujarat secured the top rank overall with 56.6 points, followed by Maharashtra (53.7), Tamil Nadu (53.3), Goa (53.1), and Odisha (52.4).
- Among Large States, Gujarat, Maharashtra, and Tamil Nadu took the leading spots.
- Among Hilly and North Eastern States, Uttarakhand ranked highest, followed by Assam and Himachal Pradesh.
- Among Union Territories and City States, Delhi and Chandigarh emerged as top performers.
- Gujarat performed exceptionally due to fast port turnarounds, stable power supply, generating 31% of India's merchandise exports, and maintaining a low fiscal deficit of 2.81% of GSDP in FY24.
- Maharashtra led in business climate by securing 35% of India's private equity and venture capital investments alongside setting up maximum Atal Tinkering Labs.
- Tamil Nadu excelled in infrastructure through an almost 100% conversion rate of industrial MoUs into actual investments.
- Goa scored highest in resources and regulatory ease among smaller regions due to high spending on healthcare, skilling, and green energy.
Why Does India Need a State Level Investment Index?
- While India grew at an average real GDP rate of 6.1% between FY1992 and FY2025, the World Bank India Country Economic Memorandum (2025) states India needs 7.8% growth annually to become high income by 2047.
- Data from the RBI KLEMS database shows that capital creation has driven over half of India's total economic growth since 1991.
- India's investment rate was 29.9% of GDP in FY25, which is significantly lower than the 40%+ rates seen during peak growth in Japan, South Korea, and China.
- Over 85% of all foreign direct investment goes to just 5 states (Maharashtra, Karnataka, Gujarat, Delhi, and Tamil Nadu), while North Eastern states receive under 1%.
- Since central government spending faces limits, future growth relies heavily on private investment and policy reforms driven by states.
Challenges in Attracting Investments Across States
- A huge gap of 32 points exists between top scorer Gujarat (56.6) and lowest scorer Lakshadweep (24.5), showing severe regional inequality.
- Investors still face long waiting times for project approvals, land acquisition hurdles, and a shortage of skilled industrial workers.
- Financial tax incentives alone fail to attract long term capital if regulatory policies remain unstable or unpredictable.
- Even the best performing state scored under 60 out of 100, showing that all states need further administrative reforms.
- States like Jammu & Kashmir, Chhattisgarh, Rajasthan, Tripura, Nagaland, and Uttar Pradesh face acute shortages of technical labor.
- Digital clearance portals in Jammu & Kashmir are often bypassed, forcing investors to file physical grievances manually.
- Investors in Bihar express worries over local law and order along with poor flight connectivity to smaller towns.
- High state debt burdens harm investment, with Bihar's debt ratio 500 basis points above national average and J&K's fiscal deficit near 9% of GSDP.
- In Jammu & Kashmir, mobile tower density stands at just 0.82 per sq km, leading to poor digital connectivity for businesses.
- High pollution levels with AQI between 200 and 600 in Noida, Ghaziabad, and Muzaffarnagar create serious living and operational issues.
- Inadequate cargo infrastructure and lack of active airports in states like Sikkim, Bihar, and Odisha create major logistics delays.
- States like Andhra Pradesh and Telangana face investor frustration over long delays in releasing promised financial incentives.
- Hilly regions face tough geography that limits land availability, resulting in Ladakh scoring the lowest overall score of 27.0.
Way Forward
- States should reform land allocation rules and update workforce skills through programs like Skill India Mission and PMKVY.
- Clearance timelines should be cut from 6–18 months down to 30–60 days by fully enforcing the National Single Window System (NSWS).
- States ought to design target policies using the Production Linked Incentive (PLI) Scheme, mirroring Gujarat's Semiconductor Policy and Tamil Nadu's EV Policy.
- Industrial growth hubs should be built along major economic routes like PM Gati Shakti, NICDP, GIFT City, and the Chennai–Bengaluru Industrial Corridor.
- States must improve business conditions by reducing unnecessary regulatory approvals and compliance paperwork.
- State governments need to improve financial discipline to free up public funds for basic infrastructure development.
- Power distribution must be upgraded under the Revamped Distribution Sector Scheme (RDSS) while digital infrastructure expands via BharatNet.
- Institutions must offer stable policies, quick land clearances, and reliable legal redressal to boost investor trust.
- Workforce capability should be expanded using the National Apprenticeship Promotion Scheme (NAPS) alongside vocational training.
- Industrial projects must integrate climate survival strategies under the National Action Plan on Climate Change (NAPCC).
- The Investment Friendliness Index should be conducted regularly to help states learn from each other and improve policies over time.
Conclusion
- The Investment Friendliness Index shifts focus from simple ease of doing business scores to continuous, state level structural reforms.
- By encouraging competitive federalism, this tool can help states improve local governance and support India's goal of Viksit Bharat @2047.
Mains Practice Question
- Despite government policy reforms, private investments remain heavily clustered in a small number of Indian states. Examine the key structural reasons behind these regional disparities.
Frequently Asked Questions (FAQs)
- What is the Investment Friendliness Index? It is a assessment tool created by NITI Aayog that evaluates how prepared Indian states are for investments using 84 indicators.
- Why was the IFI introduced? It aims to foster competitive federalism and support the Viksit Bharat @2047 goal through state level evidence based reforms.
- What are the main evaluation pillars of the Index? The index evaluates 8 pillars: Infrastructure, Business Climate, Resources, Government Policy, Regulatory Ease, Institutional Environment, Financial Health, and Environmental Resilience.
- What major challenges hinder investment across states? The main obstacles include unequal FDI distribution, regulatory delays, skilled worker shortages, weak logistics, and high state debt.
- What solutions can make states more competitive? Recommended measures include single window systems, land and labor reforms, PLI scheme implementation, and faster infrastructure expansion.