The Economics of Falling Net FDI in India
#GS-3 #Economy #Growth #Inflation #Banking #Infrastructure #Employment
Key takeaways
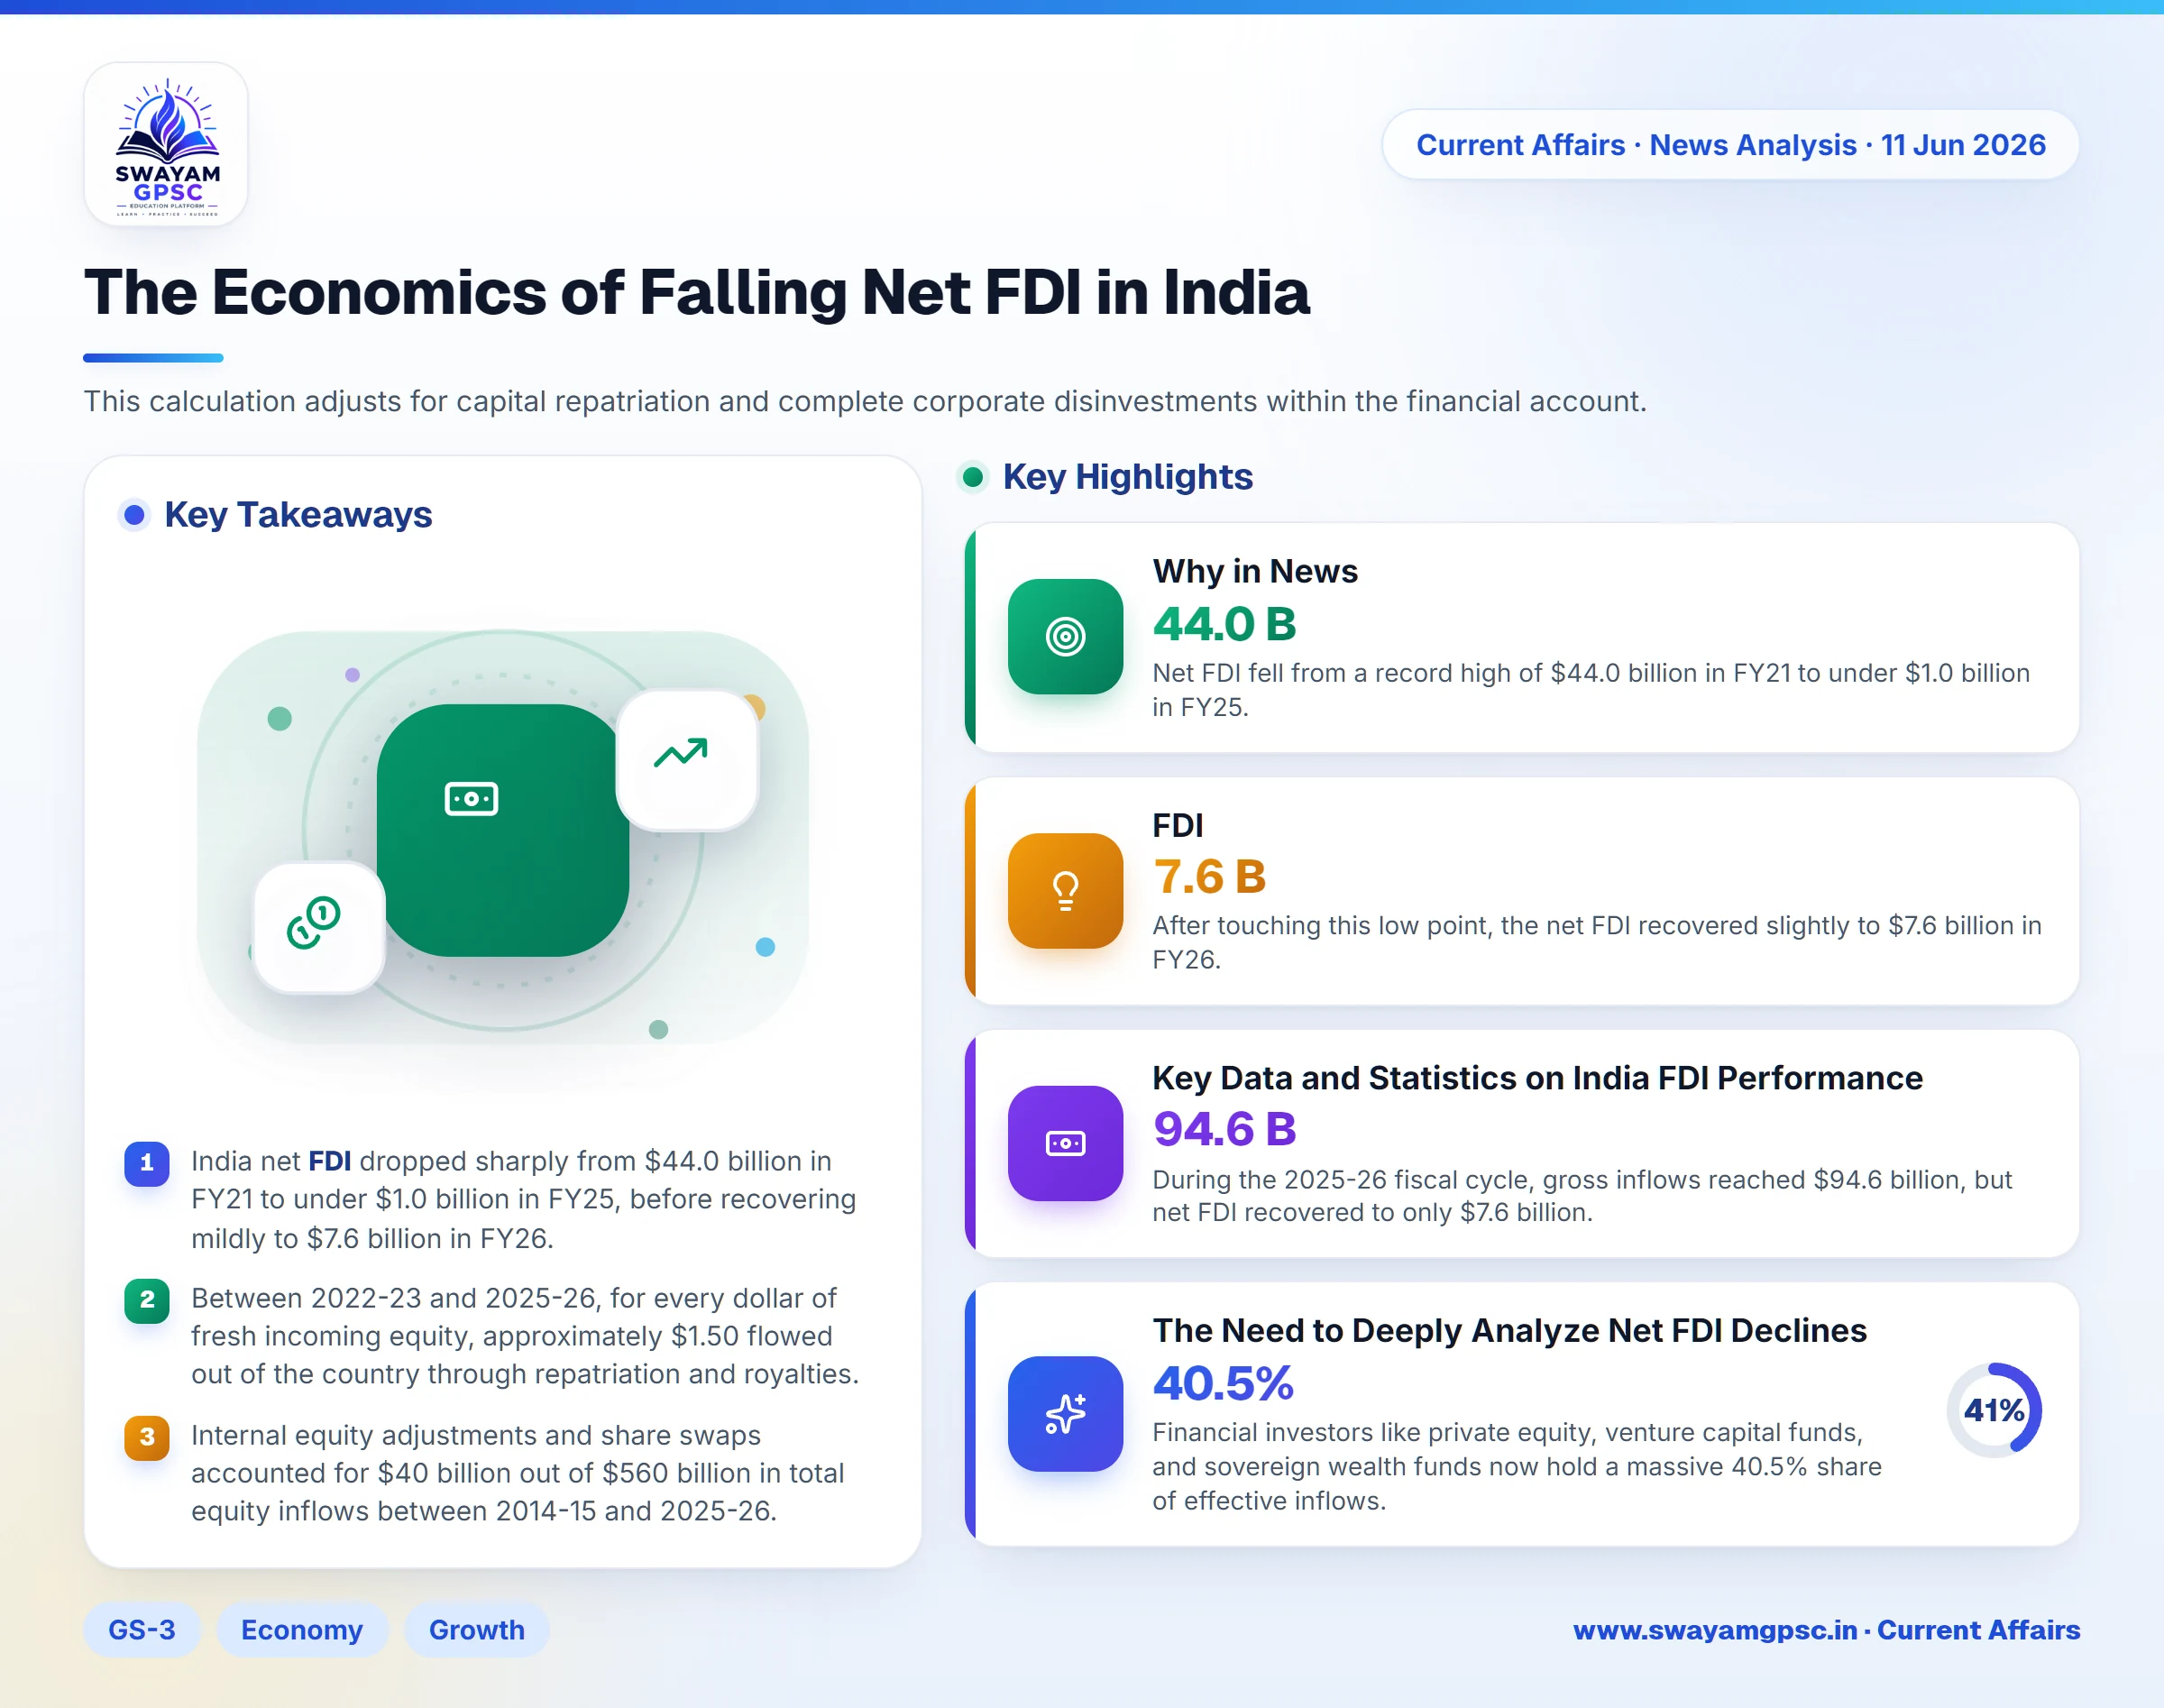
- India net FDI dropped sharply from $44.0 billion in FY21 to under $1.0 billion in FY25, before recovering mildly to $7.6 billion in FY26.
- Between 2022-23 and 2025-26, for every dollar of fresh incoming equity, approximately $1.50 flowed out of the country through repatriation and royalties.
- Internal equity adjustments and share swaps accounted for $40 billion out of $560 billion in total equity inflows between 2014-15 and 2025-26.
- Attributable intellectual property rights and royalty payments drained $46.6 billion out of the Indian economy between 2022-23 and 2025-26.
Why in News
- A detailed economic report reveals a major structural drop in India's net Foreign Direct Investment (FDI).
- Net FDI fell from a record high of $44.0 billion in FY21 to under $1.0 billion in FY25.
- After touching this low point, the net FDI recovered slightly to $7.6 billion in FY26.
About Net versus Gross FDI
- Gross FDI counts all cross-border money moving directly into the domestic economy within a fiscal year, showing incoming investor interest.
- Net FDI is calculated under Balance of Payments (BoP) rules as the difference between gross inflows and structural capital outflows.
- This calculation adjusts for capital repatriation and complete corporate disinvestments within the financial account.
Key Data and Statistics on India FDI Performance
- India saw a massive vertical collapse in net FDI as it dropped from $44.0 billion in 2020-21 to less than $1 billion in 2024-25.
- During the 2025-26 fiscal cycle, gross inflows reached $94.6 billion, but net FDI recovered to only $7.6 billion.
- Between 2022-23 and 2025-26, for every single dollar of fresh incoming equity, about $1.50 left the country through repatriation, dividends, and royalties.
- This exit ratio worsened over twelve years, rising from 56 cents per dollar between 2014-15 and 2017-18 to 70 cents between 2018-19 and 2021-22, before reaching its current high.
The Need to Deeply Analyze Net FDI Declines
- Looking closely at the decline helps reveal the changing mix of foreign investment and shows that not all money represents long-term development.
- Financial investors like private equity, venture capital funds, and sovereign wealth funds now hold a massive 40.5% share of effective inflows.
- Traditional real FDI now stands at 41.9%, matching the share of financial investors closely.
- Tracking the investment mix shows that money is increasingly avoiding complex, greenfield industrial asset creation.
- Policy analysts must separate accounting definitions to see what is truly depressing the financial accounts.
- Headline gross numbers are often inflated by paper-shuffling transactions that do not bring any new economic capital.
- Internal reorganizations, share swaps, and external commercial borrowing conversions made up $40 billion of the $560 billion equity inflows between 2014-15 and 2025-26.
- Large corporate outbound investments need careful study to separate genuine global expansions from potential capital flight.
- A major 45% of India's $65 billion outbound capital went into holding companies and special purpose vehicles in financial hubs like Singapore and the United Arab Emirates.
Initiatives and Policy Tools Deployed So Far
- The historic 1991 Liberalization introduced an open FDI policy aimed at technology acquisition, export promotion, and foreign exchange conservation.
- The creation of GIFT City financial channels set up an international financial center to regulate cross-border capital.
- This move drove total internal and outbound flows to $1.40 billion and $2.35 billion respectively.
- The Reserve Bank of India (RBI) deployed real-time accounting frameworks to track micro-remittances and corporate share conversions across domestic sectors.
- Updated corporate rules allowed Indian multinationals like TML Commercial Vehicles to invest strategically overseas and acquire foreign manufacturing assets.
Challenges
- Financial investors are liquidating their local holdings at a large scale, creating massive capital account deficits.
- Singapore's Temasek exited Schneider Electric India in 2025, turning an initial $637 million investment into a $6.4 billion cash payout.
- Large corporate share sales by foreign entities can hide ongoing capital repatriation under the cover of local public offerings.
- Foreign capital now focuses more on digital platforms and tech services instead of building physical factories, which slows down long-term technology transfers.
- A portion of incoming capital moves through offshore tax shelters, raising serious concerns about investment quality.
- Diaspora and special purpose vehicle flows account for 17.6% of effective inflows, often involving recycled Indian money passing through foreign centers.
- Multinationals frequently use high internal royalty payments to send profits back home instead of paying standard corporate dividends.
- Attributable intellectual property rights and royalty payments alone drained $46.6 billion out of the country between 2022-23 and 2025-26.
Way Forward
- Policymakers must move past tracking simple gross volumes and focus investment metrics on greenfield, long-term industrial capital injections.
- The RBI must separate genuine fresh equity capital from internal share swaps, debt conversions, and corporate restructurings in public data releases.
- The Production-Linked Incentive (PLI) schemes should be aligned to attract traditional multinationals willing to commit capital to core manufacturing for over a decade.
- The government must tighten oversight on double tax treaties and offshore corporate shelters to reduce capital recycling and domestic round-tripping.
- Transparent limits should be set on intellectual property and consultancy fee transfers to ensure multinationals reinvest more of their local earnings within the country.