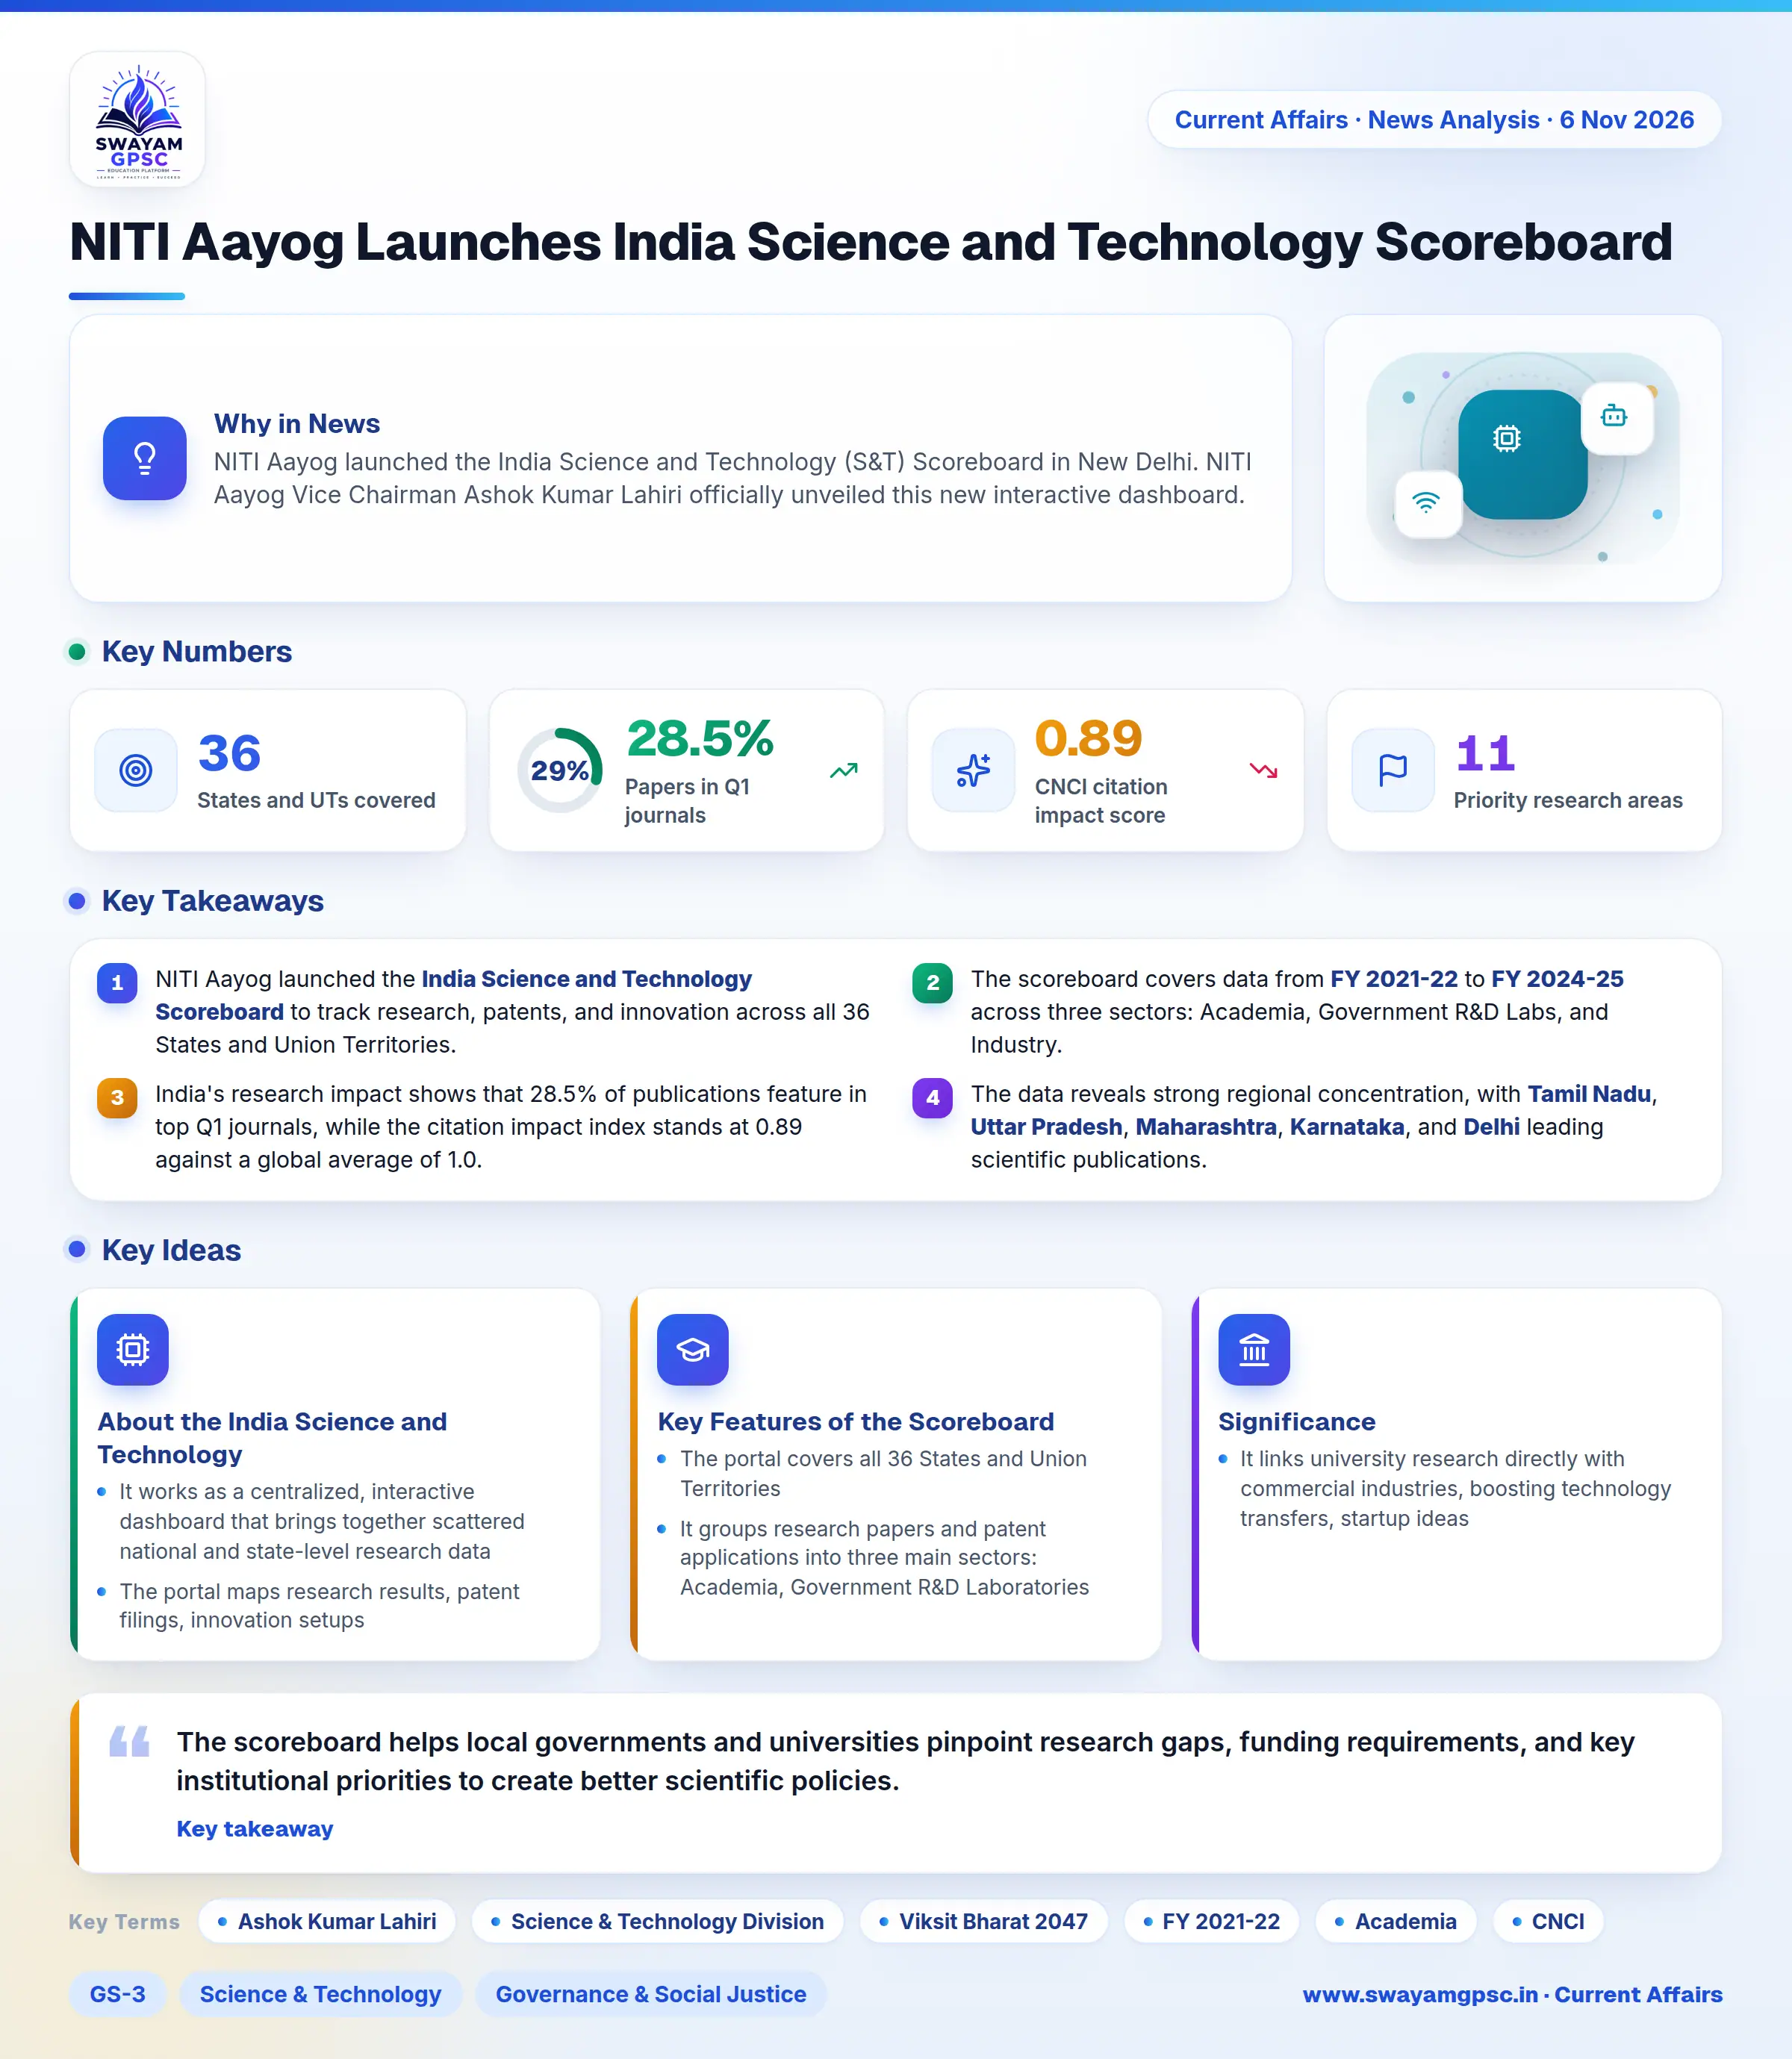
NITI Aayog Launches India Science and Technology Scoreboard
#GS-3 #Science & Technology #Governance & Social Justice #ICT #Good Governance #Innovation #NITI Aayog
Key takeaways
- NITI Aayog launched the India Science and Technology Scoreboard to track research, patents, and innovation across all 36 States and Union Territories.
- The scoreboard covers data from FY 2021-22 to FY 2024-25 across three sectors: Academia, Government R&D Labs, and Industry.
- India's research impact shows that 28.5% of publications feature in top Q1 journals, while the citation impact index stands at 0.89 against a global average of 1.0.
- The data reveals strong regional concentration, with Tamil Nadu, Uttar Pradesh, Maharashtra, Karnataka, and Delhi leading scientific publications.
Why in News
- NITI Aayog launched the India Science and Technology (S&T) Scoreboard in New Delhi.
- NITI Aayog Vice Chairman Ashok Kumar Lahiri officially unveiled this new interactive dashboard.
About the India Science and Technology Scoreboard
- It works as a centralized, interactive dashboard that brings together scattered national and state-level research data into one single place.
- The portal maps research results, patent filings, innovation setups, and institutional strengths across all States and Union Territories.
- NITI Aayog's Science & Technology Division created this dashboard by working with scientific bodies and major research databases like Web of Science and Clarivate.
- Its main goal is to spot regional research strengths and weaknesses, encourage healthy competition among states, and match local scientific growth with the Viksit Bharat 2047 vision.
Key Features of the Scoreboard
- The portal covers all 36 States and Union Territories, tracking research performance from FY 2021-22 to FY 2024-25 across universities, labs, startups, and incubators.
- It groups research papers and patent applications into three main sectors: Academia, Government R&D Laboratories, and Industry.
- The system evaluates research quality using key metrics, showing that 8.5% of papers reach the top 10% most-cited list, 28.5% are in top-ranked Q1 journals, 29.9% involve international collaboration, and the Category Normalized Citation Impact (CNCI) stands at 0.89 compared to the global average of 1.0.
- It tracks research activity across 11 key fields, including Artificial Intelligence, Semiconductors, Clean Energy, Critical Minerals, Biotechnology, and Space Technologies.
- States and Union Territories can compare their research outputs, patent filings, and innovation policies directly with one another.
- The data highlights major regional differences, showing that most research outputs are concentrated in five key areas: Tamil Nadu, Uttar Pradesh, Maharashtra, Karnataka, and Delhi.
Significance
- The scoreboard helps local governments and universities pinpoint research gaps, funding requirements, and key institutional priorities to create better scientific policies.
- It links university research directly with commercial industries, boosting technology transfers, startup ideas, and local manufacturing capabilities.